
The National Wetlands Inventory (NWI) Program provides geospatial information that is critical to understand, protect, and promote America’s national interests. NWI’s Geospatial Dataset enables efficient decision-making that supports the health of America’s people and economy. Everyday thousands of people from commercial, non-profit, and governmental organizations, as well as private citizens, use NWI data.
Examining how often and where NWI data is used provides insights into the importance of these data to decisions-makers across the nation.
NWI Mapper and Web Services
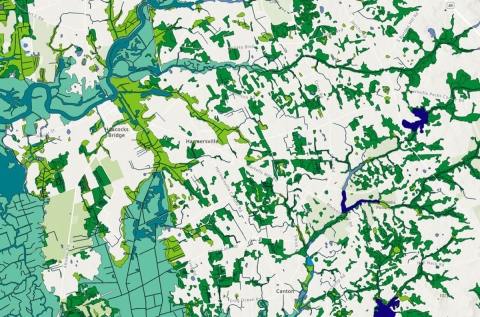
NWI’s Geospatial Dataset is provided to the public through the Wetlands Mapper and Web Map Services. The Wetlands Mapper provides map-like views of the Nation's wetland and deepwater resources and allows users to query, download, and print data.

In 2024 the Wetlands Mapper had:
More than 306,000 users
Nearly 550,000 Mapper views
Over 5 million requests for information
More than 286,000 downloads
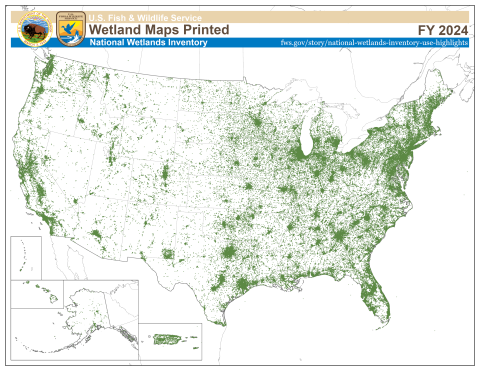
Over 290,000 maps printed
NWI's web map services allow users to quickly display and query data using GIS software and mapping applications. Federal, state and Tribal agencies, energy and infrastructure development companies, as well as outdoor, recreation, and conservation organizations use NWI web map services to inform decision-making and better serve the American public.
In 2024, NWI web map services received nearly 45 million requests for information.
NWI Mapper Prints
The Wetlands Mapper allows users to print maps for their area of interest - one of the Mapper's most utilized functions. By examining where users are printing maps, we can infer how the data is being used. This information helps the NWI Program prioritize user needs and implement strategies to improve user engagement.
Since 2015, over 2.3 million maps have been printed from the Wetlands Mapper.
When examining the locations of NWI map prints, patterns begin to emerge. Below are examples of patterns in the distribution of Mapper prints that reflect varying uses of NWI data.
Energy Development:

Transportation:

Urban Planning:

To explore more NWI use examples, please visit our StoryMap
When maps are printed, also reflect their use.
The majority of NWI maps are printed during the workweek, indicating these data support decision-making across the American workforce.


